

If you've been watching the West Houston real estate market, you've probably noticed things shifting. Whether you're a first-time buyer trying to understand pricing trends, a move-up buyer evaluating your next step, or a longtime homeowner wondering about your property's value, August's market data offers valuable clues. Let's break down what happened in our region and what it means for your real estate decisions.
Understanding Market Cycles Through Data
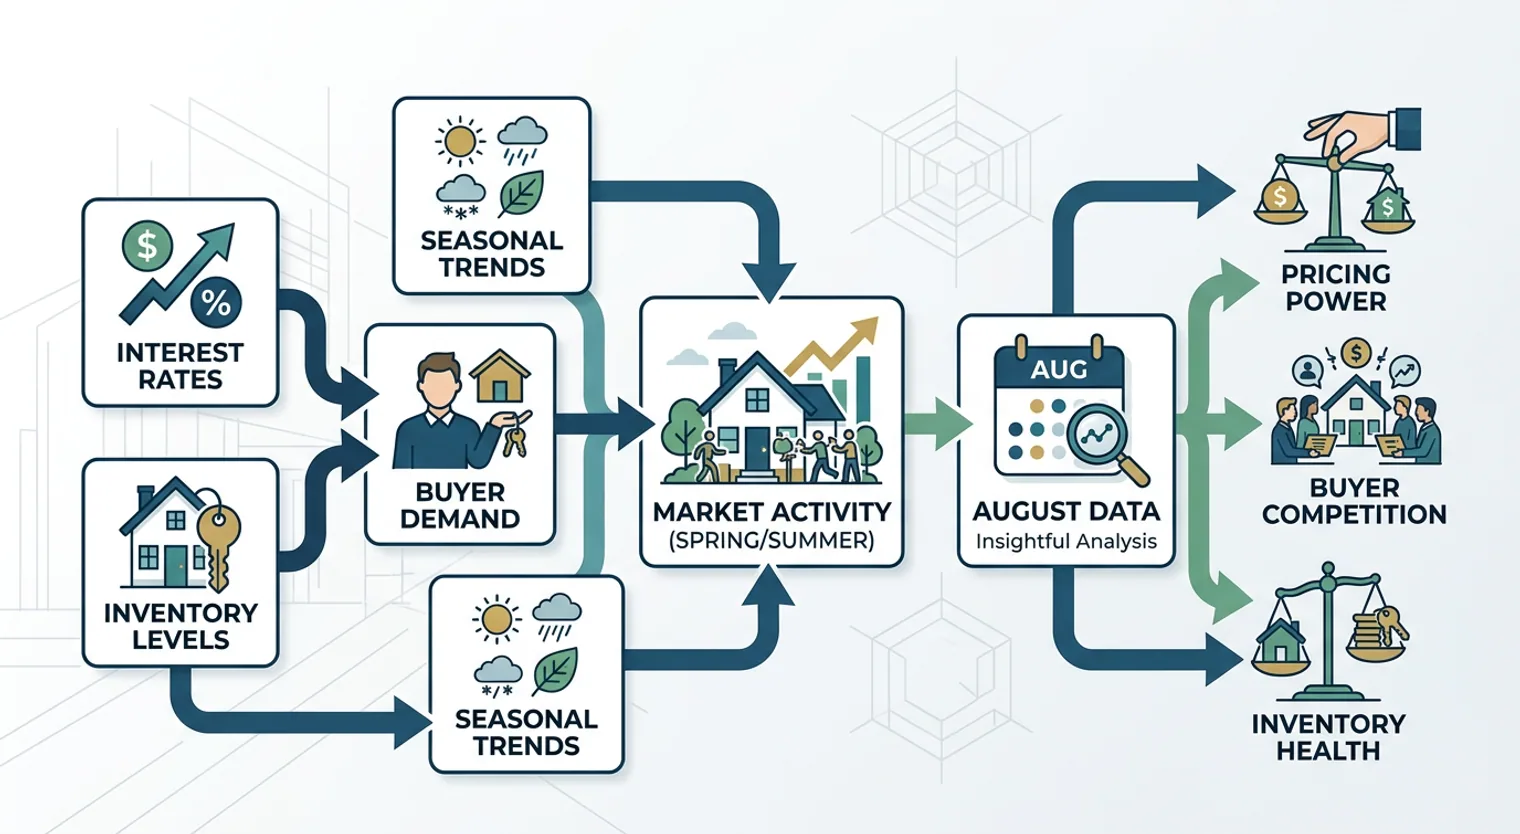
Real estate markets aren't random—they follow patterns shaped by interest rates, inventory levels, buyer demand, and seasonal trends. August is a particularly telling month because it captures late-summer buyer activity while reflecting how spring and early-summer transactions closed. For West Houston communities like Sugar Land and Missouri City, August data reveals critical insights about pricing power, buyer competition, and inventory health.
Why August matters: This month sits at the intersection of summer activity and fall preparation. Families are finalizing school-year moves, corporate relocations are processing, and builders are clearing summer inventory before the fall market. Understanding these patterns helps you time your own decision—whether buying or selling.
Key Market Indicators to Track
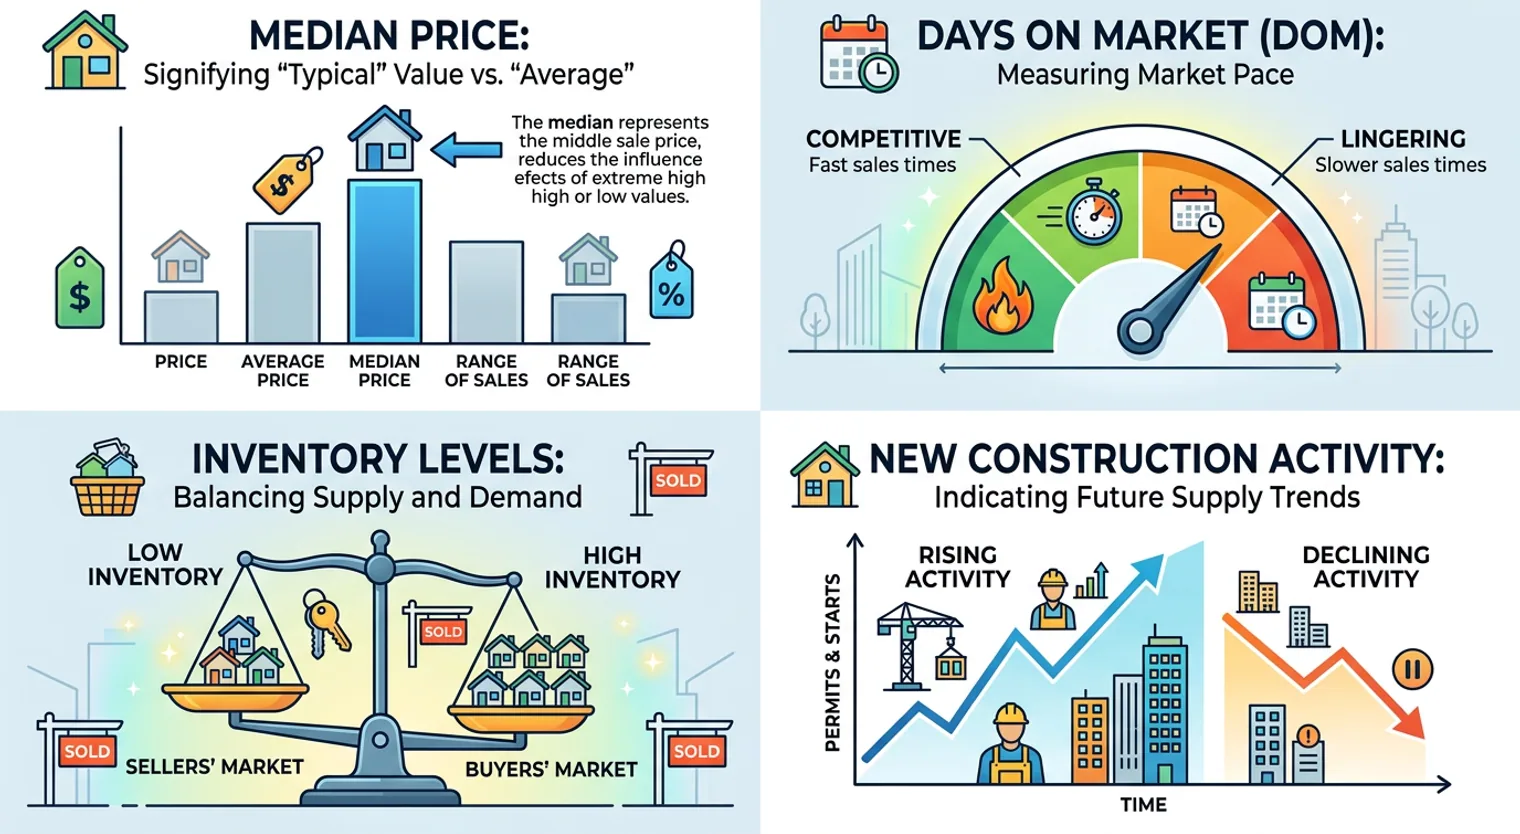
Median prices tell you what a "typical" home sold for in your area. This matters more than average prices because one luxury estate sale can skew averages upward. When median prices rise month-over-month, it often signals strong buyer demand and limited inventory. When they flatten or decline, it may indicate shifting buyer preferences or increased supply.
Days on market (DOM) reveals buyer urgency. Homes selling in 20-30 days suggest competitive conditions where sellers have leverage. Homes lingering 45+ days indicate buyer caution or overpricing. In West Houston's competitive markets, tracking DOM by neighborhood helps you understand whether you're in a seller's market or a buyer's market.
Inventory levels directly impact your negotiating position. Low inventory (under 3 months of supply) favors sellers—fewer homes mean less competition. High inventory (over 6 months) favors buyers—more options mean better negotiating power. August inventory often reflects summer's rush; comparing it to July and September reveals seasonal patterns.
New construction activity deserves special attention if you're considering a new home. August closings represent contracts signed months earlier, so they reflect spring market conditions. Rising new-construction sales suggest builder confidence and available financing; declining activity may signal builder caution about future demand.
What This Means for Your Decision

If you're a relocation or move-up buyer, understanding whether your target neighborhood is in a seller's or buyer's market changes your strategy. In seller's markets, you need stronger offers and faster decisions. In buyer's markets, you have time to negotiate and inspect thoroughly.
If you're a first-time buyer, market data helps you avoid FOMO (fear of missing out) decisions. Strong data doesn't mean you must buy now; it means understanding your actual negotiating position and timeline.
If you're an existing homeowner considering a sale, August data tells you whether conditions favor listing now or waiting. Rising prices and low inventory suggest favorable selling conditions; declining activity might mean waiting for fall.
The key insight: Markets provide information, not pressure. Use August's data as one input among many—your personal timeline, financial readiness, and life circumstances ultimately drive the right decision.
Community Impact Newspaper tracked Sugar Land and Missouri City's August real estate performance, providing local market data on median prices, inventory levels, days on market, and new construction activity. This official market report offers the specific August metrics needed to understand how our region's housing market is performing and what conditions mean for buyers and sellers making decisions: See how Sugar Land, Missouri City's real estate market fared in August
Track Your Local Market
Community Impact Newspaper publishes monthly market reports for Sugar Land, Missouri City, Katy, and surrounding West Houston communities. These reports include median prices, inventory, days on market, and new construction data—exactly what you need to understand conditions in your target area. Bookmark their real estate section and check monthly reports to build your own market knowledge over time.
Community Impact's monthly real estate market reports provide accessible, local data for West Houston communities, making it easy to track trends and understand your market without needing a real estate license: See how Sugar Land, Missouri City's real estate market fared in August
August's market data is a snapshot, not a crystal ball. The real value lies in understanding what conditions mean for your specific situation—whether you're buying, selling, or simply evaluating options. Use this month's numbers as one piece of information, combine them with your personal timeline and financial readiness, and make decisions based on your needs, not market noise.
Get guidance for your specific move.
Online research is a useful starting point. The home, neighborhood and timing still need to work together. Text John with what you are considering and get a practical next step.
Text John