
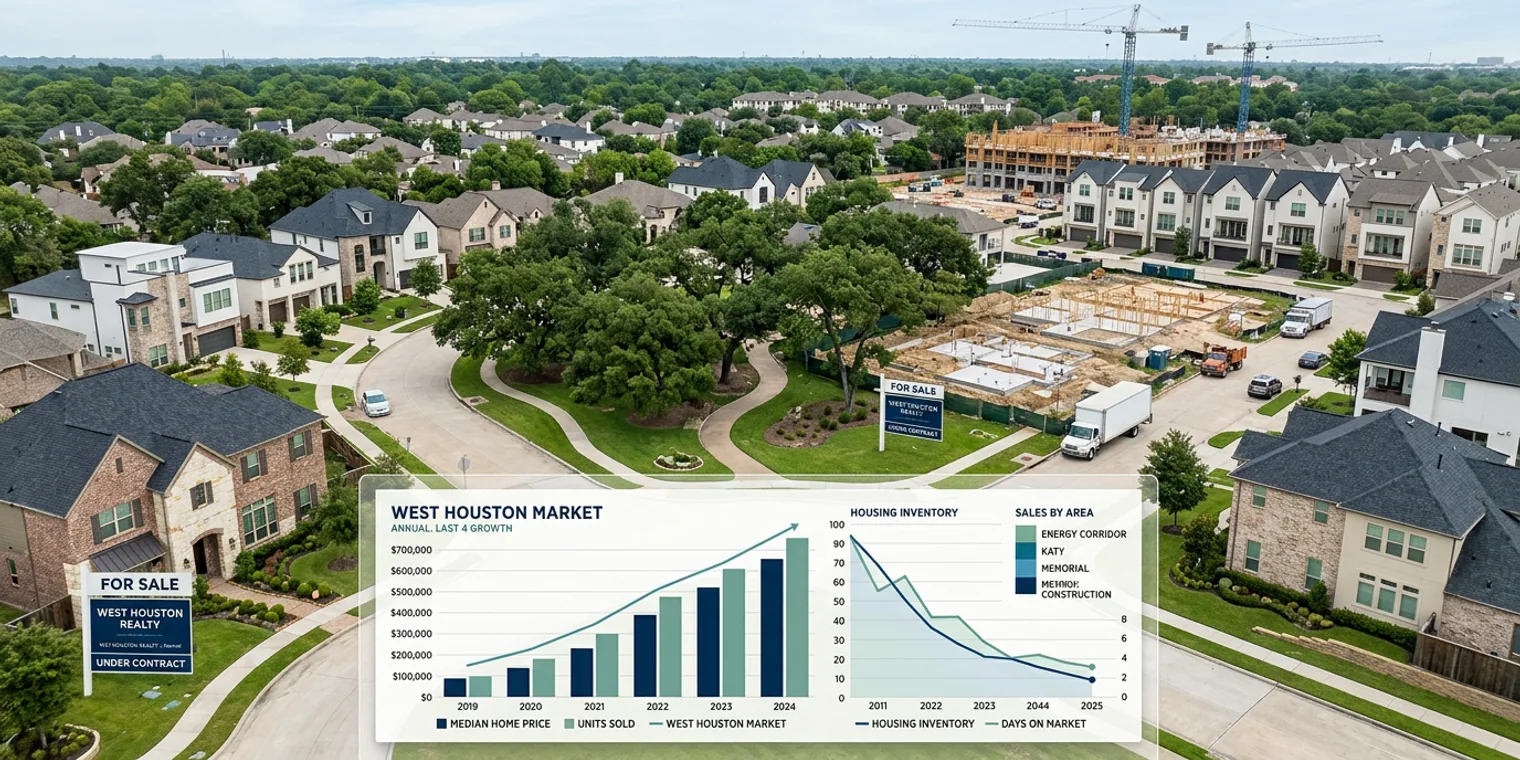
Whether you're considering a move to Katy, Sugar Land, or the Energy Corridor, or you're already a homeowner wondering about your property's value, market data is your compass. This month, we're breaking down what recent market activity means for your decision—and why timing, inventory, and price trends matter more than you might think.
Reading Your Local Real Estate Market: A Practical Guide
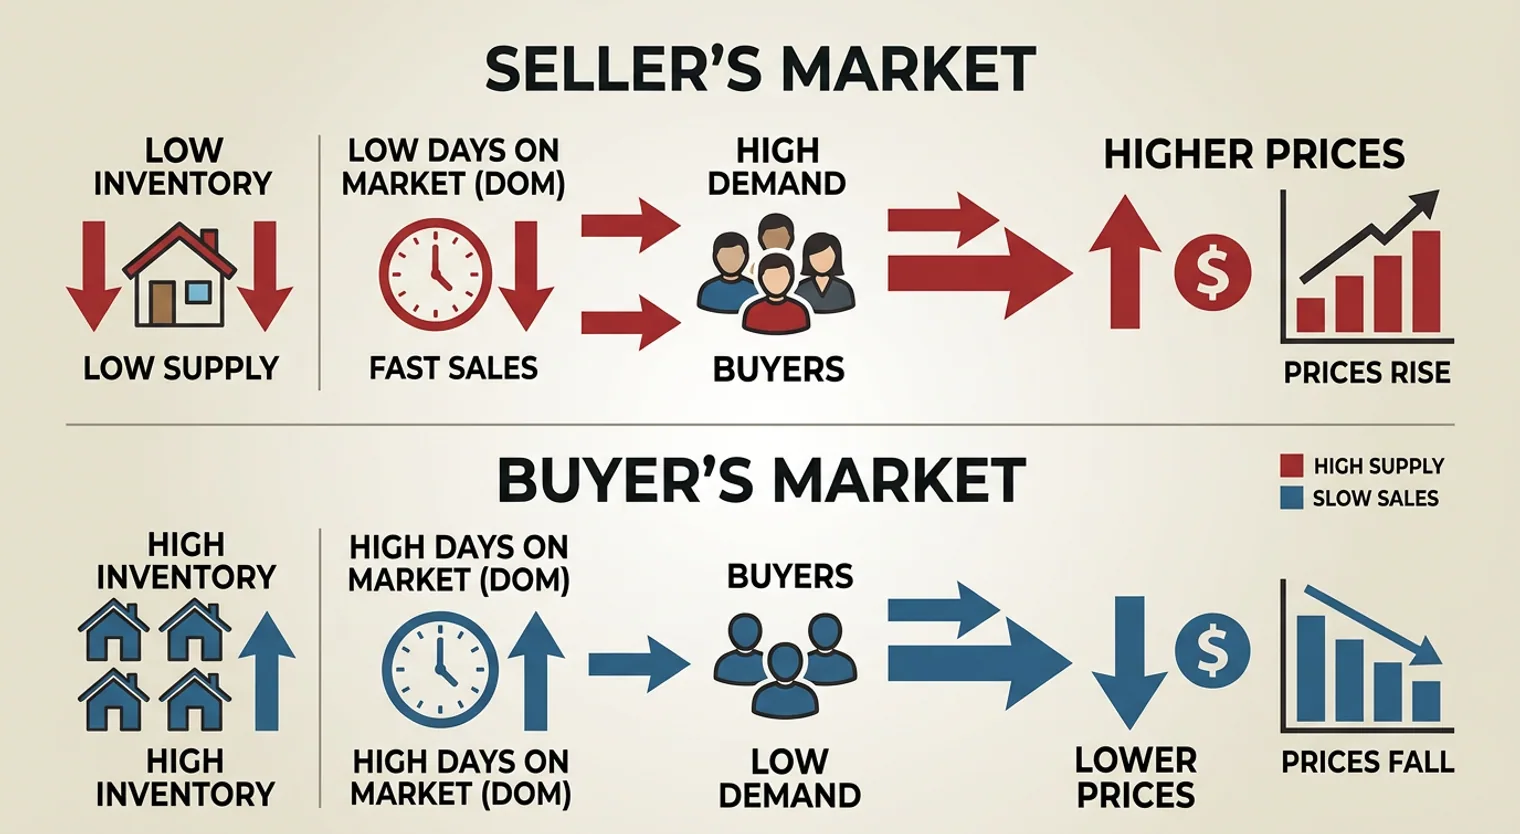
When you hear "the market is up" or "inventory is tight," what does that actually mean for your wallet and your timeline? Let's decode the key metrics that matter.
What the Numbers Tell You
Real estate markets move in cycles. Recent data from our region shows activity patterns that directly affect three critical decisions: whether to buy now or wait, whether to sell, and what price to expect.
Days on Market (DOM) is one of the most telling indicators. When homes sell quickly (under 30 days), it signals strong buyer demand and often means sellers have pricing power. Conversely, homes lingering 60+ days suggest either overpricing, market saturation, or buyer hesitation. For West Houston communities, understanding this metric helps you gauge whether you're in a buyer's or seller's market.
Inventory levels directly impact your negotiating position. Low inventory (under 3 months of supply) typically favors sellers and can mean fewer options for buyers, potentially forcing you to act faster or expand your search area. Higher inventory gives buyers breathing room to negotiate and compare properties carefully.
Price trends tell you whether values are appreciating or softening. A year-over-year price comparison shows whether your home is building equity or whether it's a buyer's opportunity. This matters whether you're planning to build wealth through homeownership or timing an exit.
Why This Matters for Your Specific Situation
If you're a first-time buyer, tight inventory and rising prices might push you toward new construction in developing areas like Fulshear or Cypress, where builders often offer incentives when market conditions soften. If you're a move-up buyer, understanding whether your current home's equity has grown helps you calculate how much you can invest in your next property. For long-term homeowners considering a sale, knowing whether it's a seller's market helps you decide if now is your moment.
The Hidden Layer: Seasonal Patterns
West Houston's market has seasonal rhythms. Summer months (June-July) typically show different activity than fall. Understanding whether current conditions are seasonal or structural helps you avoid making emotional decisions based on temporary fluctuations.
Action Steps
Before making any move—whether buying, selling, or holding—pull three months of market data for your specific neighborhood or desired community. Compare average sale prices, days on market, and inventory levels. This evidence-based foundation replaces guesswork with clarity.
See how Sugar Land, Missouri City's real estate market fared in July Source: Community Impact Newspaper - Sugar Land/Missouri City Edition
Community Impact Newspaper reported on July real estate activity in Sugar Land and Missouri City, providing local market metrics including sales volume, average prices, and days on market. This data offers West Houston buyers and sellers a snapshot of how their region's market performed during summer months, helping them understand current conditions and seasonal trends.
Get Your Market Data
Fort Bend and Harris County Appraisal Districts (fbcad.org, hcad.org) allow free searches of comparable sales, property values, and recent transactions in your area. Community Impact Newspaper publishes monthly real estate reports for Sugar Land, Missouri City, Katy, and Cypress with current market metrics. TxREAL (the Texas Real Estate Analysis Lab at UT Austin) offers free market analysis tools. Start with your appraisal district this week—it's your most reliable, official source.
See how Sugar Land, Missouri City's real estate market fared in July Source: Community Impact Newspaper - Sugar Land/Missouri City Edition
Community Impact's regular market reports are an accessible, free resource for West Houston homeowners seeking current, locally-specific real estate data without paywalls or sales pressure.
Market data isn't intimidating once you know where to look and what to measure. This month, take 30 minutes to pull comparable sales for your neighborhood or target community. Compare prices, days on market, and inventory. This single step transforms you from a passive buyer or seller into an informed decision-maker. John Curley is here to help you interpret what the numbers mean for your home and timeline.
Get guidance for your specific move.
Online research is a useful starting point. The home, neighborhood and timing still need to work together. Text John with what you are considering and get a practical next step.
Text John